Overview
The primary goal of this project is to
visualize the suicide rates, trends and variations that can be found in the dataset (WHO global suicide data set) and gain insight from the data. To achieve the goal examining the dataset through the several research questions would be beneficial such as
- The countries having the highest suicide rate
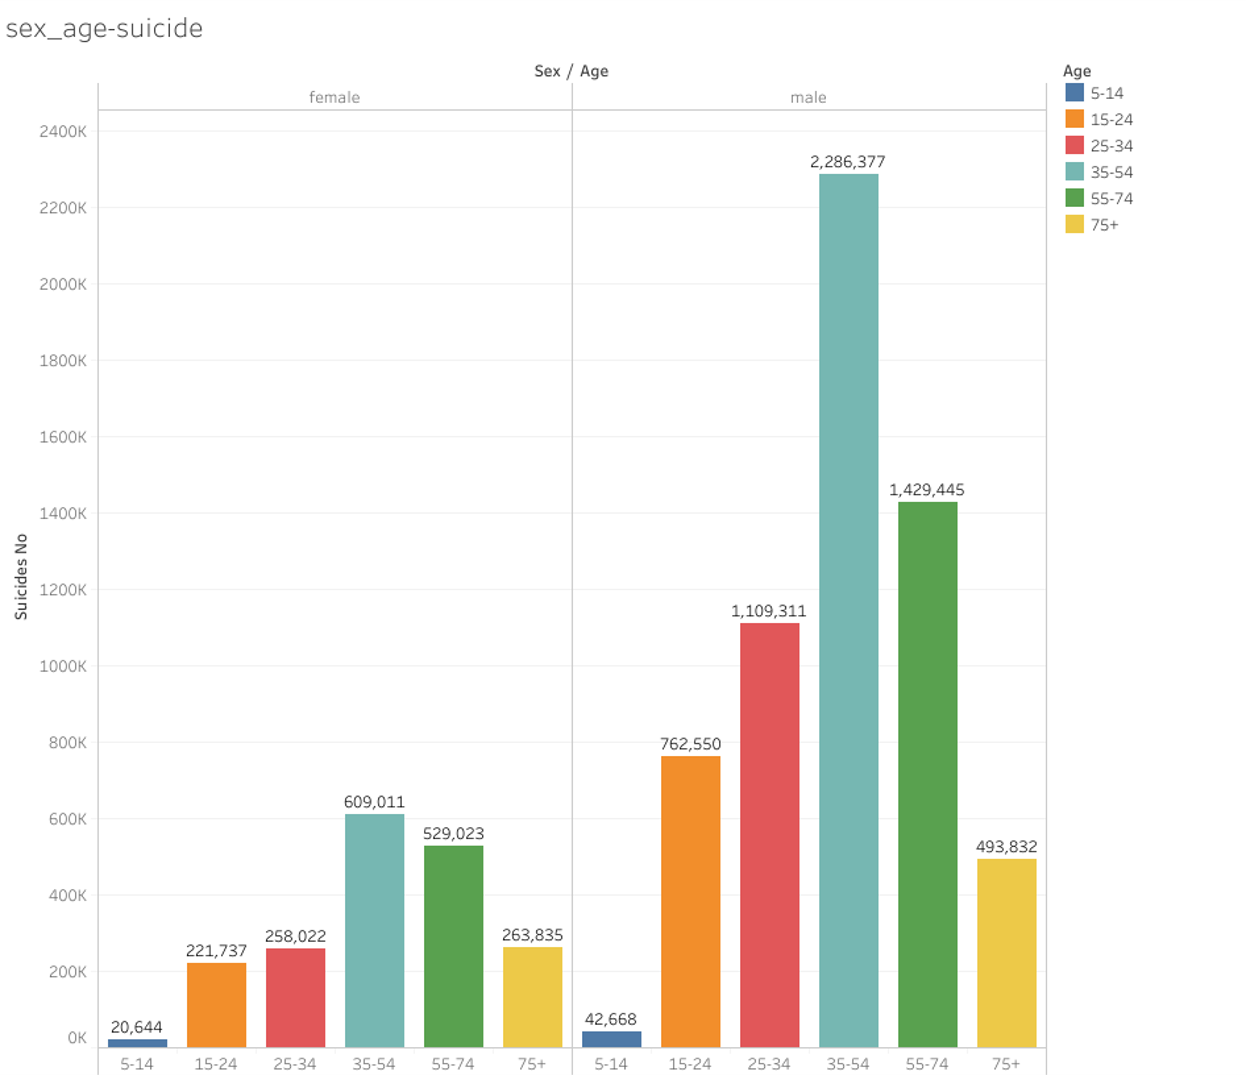
- Age group that is more susceptible to the suicidal tendencies
- Male-female suicidal propensities
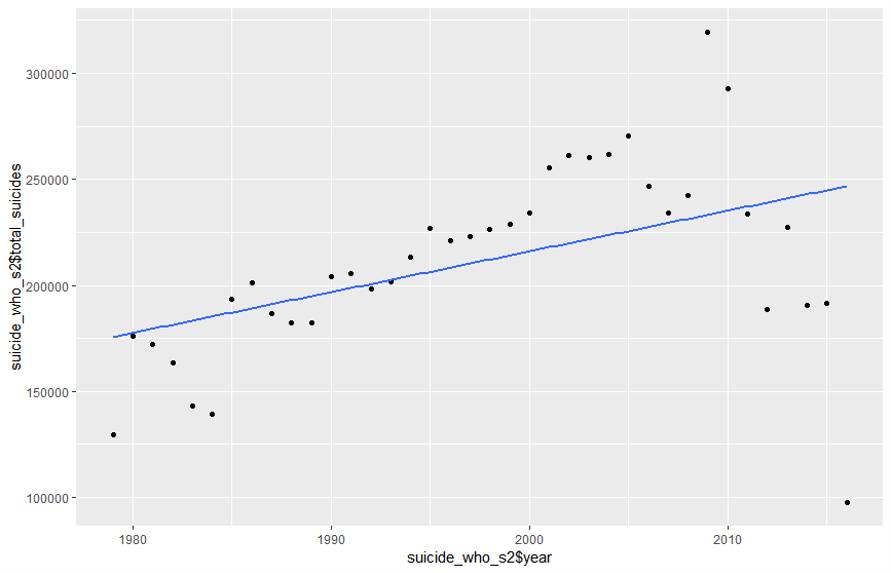
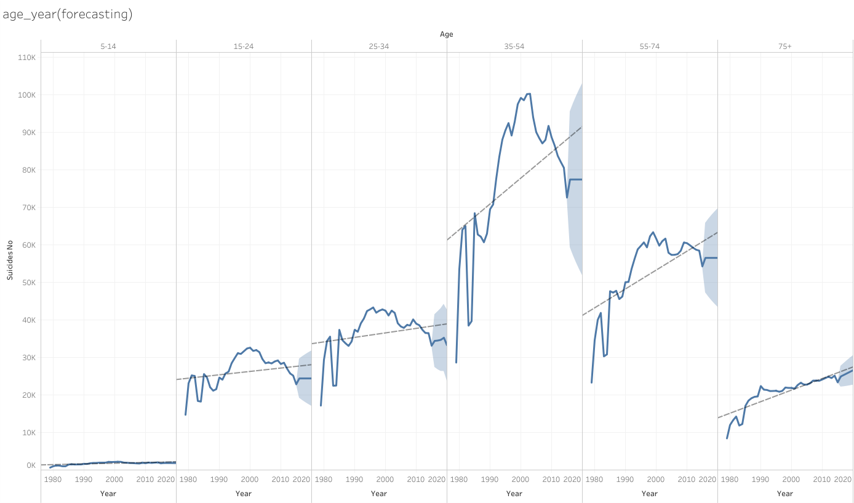
- To predict future trends will be made which might help in raising the seriousness of the issue
<
Digital Tools Used
MS-Excel
Cleaning and data formatting was done with excel
R
To manipulate the data information from the dataset using the dplyr package.
To visualize data based on the ggplot package in this project
Tableau
To visualize the data with the help of bar charts and for forecasting and prediction
Key Insights
Following section includes the visualization of the dataset:
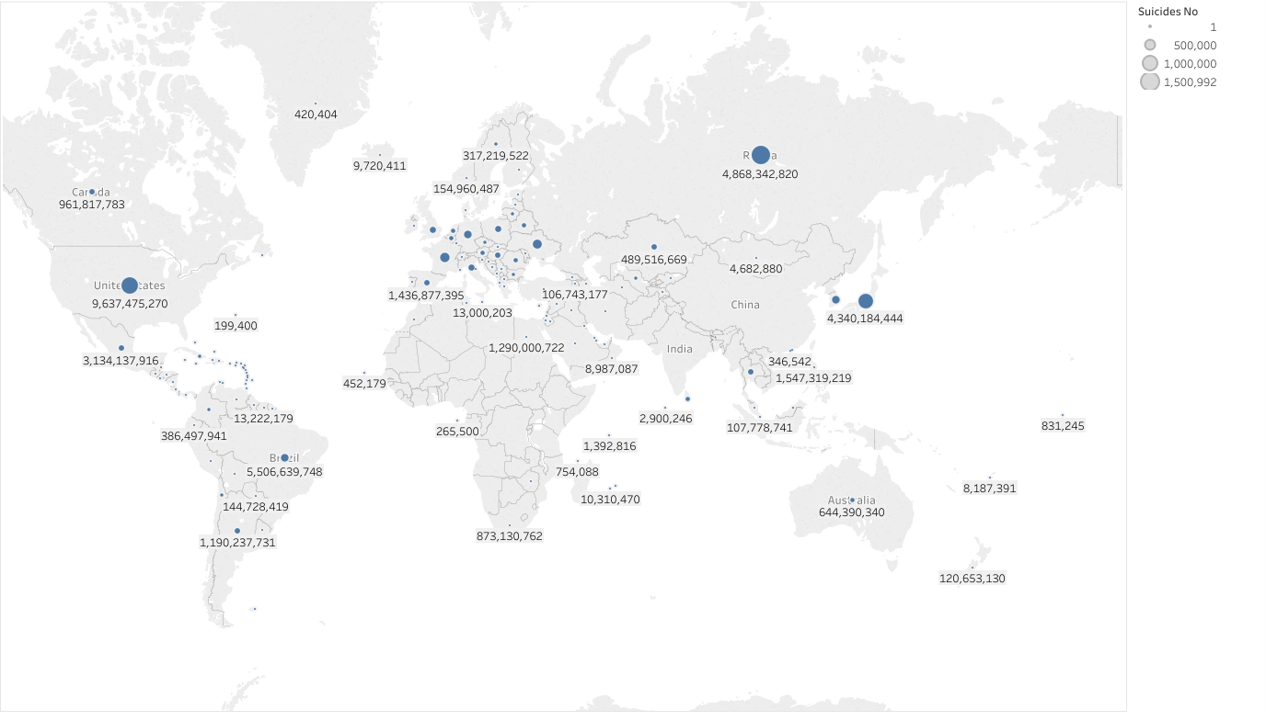
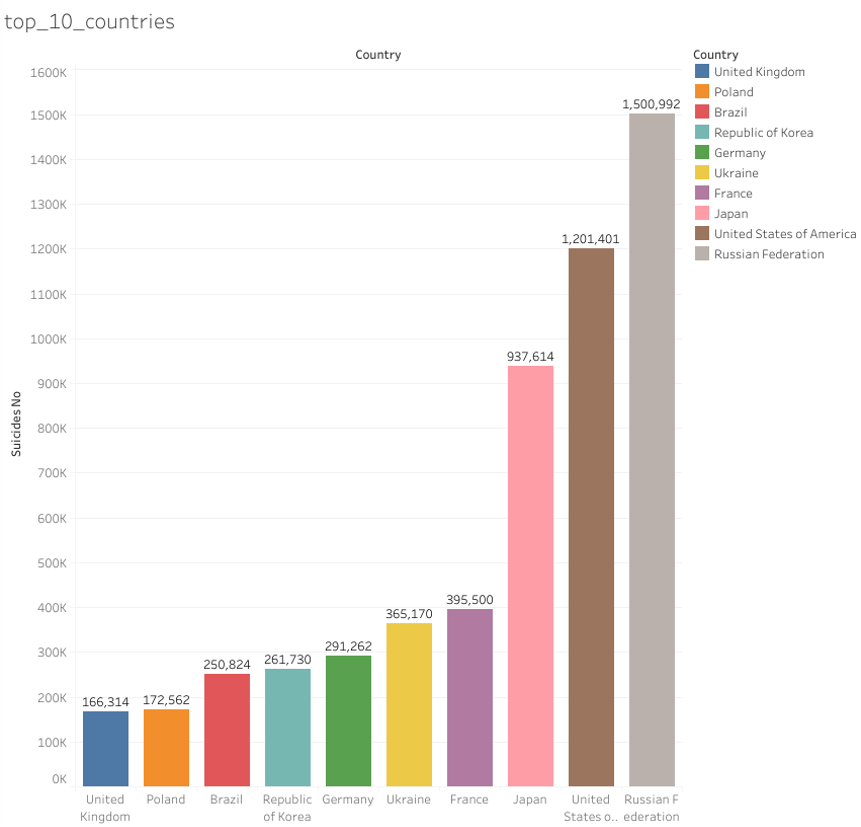
- 10 countries with highest suicide numbers